XFS and barriers
17/Nov 2009
Lately at work, we’ve been trying to figure out what the deal with barriers are, either for XFS or EXT3, the two filesystems we like most. If you don’t know what barriers are, go and read a bit on the XFS FAQ. Short story, XFS comes with barriers enabled by default, EXT3 does not. Barriers make your system a lot more secure to data corruption, but it degrades performance a lot. Give that EXT3 does not do checksumming of the journal, you could also have lots of corruptions if it’s not enabled. Go and read on wikipedia itself.
If you google a bit you’ll see that there are lots of people who are talking about it, but definitely I haven’t found and answer to what is best and under which scenarios. So, starting with a little test on XFS, here are the results, totally arbitrary on a personal system of mine. System is an Intel Core 2 Duo CPU e4500 at 2.2 GHz, 2GB of RAM and 500GB of HD in a single one XFS partition. I’m testing it with bonnie++ and here are the results. First, mounting by default (that’s it, barriers enabled)
# time bonnie -d /tmp/bonnie/ -u root -f -n 1024
Using uid:0, gid:0.
Writing intelligently...done
Rewriting...done
Reading intelligently...done
start 'em...done...done...done...done...done...
Create files in sequential order...done.
Stat files in sequential order...done.
Delete files in sequential order...done.
Create files in random order...done.
Stat files in random order...done.
Delete files in random order...done.
Version  1.96       ------Sequential Output------ --Sequential Input- --Random-
Concurrency   1     -Per Chr- --Block-- -Rewrite- -Per Chr- --Block-- --Seeks--
Machine        Size K/sec %CP K/sec %CP K/sec %CP K/sec %CP K/sec %CP  /sec %CP
kore             4G           54162   9 25726   7           60158   4 234.2   4
Latency                        5971ms    1431ms               233ms     251ms
Version  1.96       ------Sequential Create------ --------Random Create--------
kore                -Create-- --Read--- -Delete-- -Create-- --Read--- -Delete--
 files  /sec %CP  /sec %CP  /sec %CP  /sec %CP  /sec %CP  /sec %CP
 1024   260  11 489116  99   299   1   262  11 92672  56   165   0
Latency               411ms    3435us     595ms    2063ms     688ms   23969ms

real    303m50.878s
user    0m6.036s
sys    17m52.591s
#
Second time, after a few hours, doing a
mount -oremount,rw,nobarrier /
we get these results (barriers not enabled):
# date ;time bonnie -d /tmp/bonnie/ -u root -f -n 1024 ; date
Tue Nov 17 00:43:53 GMT 2009
Using uid:0, gid:0.
Writing intelligently...done
Rewriting...done
Reading intelligently...done
start 'em...done...done...done...done...done...
Create files in sequential order...done.
Stat files in sequential order...done.
Delete files in sequential order...done.
Create files in random order...done.
Stat files in random order...done.
Delete files in random order...done.
Version  1.96       ------Sequential Output------ --Sequential Input- --Random-
Concurrency   1     -Per Chr- --Block-- -Rewrite- -Per Chr- --Block-- --Seeks--
Machine        Size K/sec %CP K/sec %CP K/sec %CP K/sec %CP K/sec %CP  /sec %CP
kore             4G           66059  12 30185  10           71108   5 238.6   3
Latency                        4480ms    3911ms               171ms     250ms
Version  1.96       ------Sequential Create------ --------Random Create--------
kore                -Create-- --Read--- -Delete-- -Create-- --Read--- -Delete--
files  /sec %CP  /sec %CP  /sec %CP  /sec %CP  /sec %CP  /sec %CP
1024  1830  85 490304  99  4234  17  3420  24 124090  78   402   1
Latency               434ms     165us     432ms    1790ms     311ms   26826ms

real    67m21.588s
user    0m5.668s
sys     11m30.123s
Tue Nov 17 01:51:15 GMT 2009
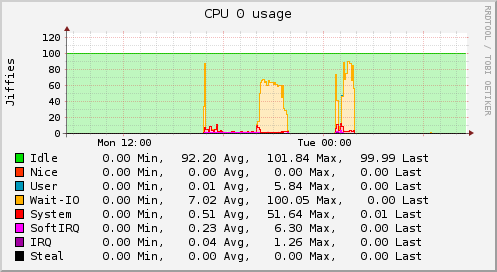
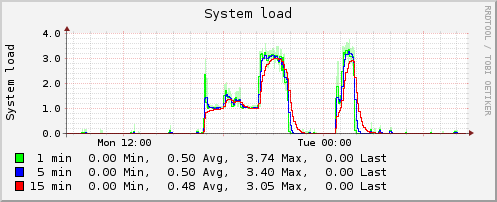
So, I think you can actually tell how different they behave. I haven’t created graphs from these results to show them graphically, but let me show you some monitoring graphs from these two experiments. The first test was run yesterday in the afternoon. The second one was run just after midnight. You can see the difference. Here showing you the CPU and load average graphs.
I’ll try to follow up shortly with more findings, if I find any ;-). Please, feel free to add any suggestion or comments about your own experiences with these problems.